alert - warning

This page has not been translated into Español. Visit the Español page for resources in that language.

Where Do Policyholder Dollars Go?

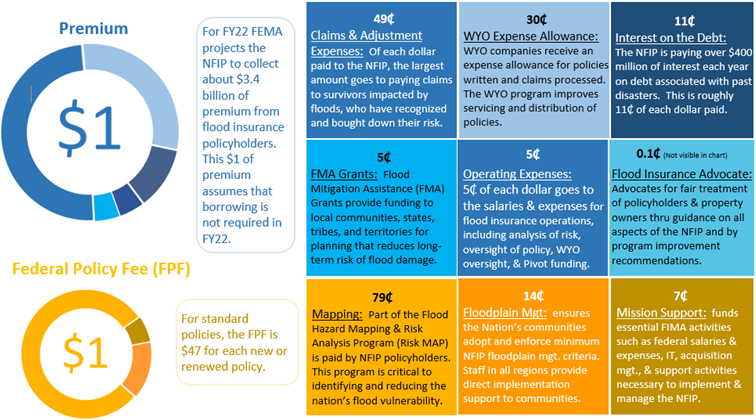
This section of the Watermark is dedicated to policyholders. It shows how their money funds NFIP activities. Each donut chart represents $1 received from a policyholder.  Categories in the first chart represent premium dollars, while categories in the second chart represent the Federal Policy Fee (FPF).  As of December 31, 2021, the average premium, including FPF, is $771.  

Graphic
Each donut chart represents $1 received from a policyholder.  Categories in the first chart represent premium dollars, while categories in the second chart represent the Federal Policy Fee (FPF).  As of December 31, 2021, the average premium, including FPF, is $771.
Tags: