

Study Summary
Study Area – Iowa
Hazard Type – Riverine Flooding
Project Type –Thirteen Iowa counties implemented acquisition, relocation, and elevation projects to reduce future damage from repeated flooding.
Total Project Cost – $23.8 million (74 projects: 379 buildings in 13 counties)
Total Losses Avoided – $24.3 million (2010 dollars)
Return on Investment (ROI) – 1.02
Pre- and Post-Mitigation Events
The State of Iowa has long been vulnerable to severe storms and flooding, and every year, damage from flooding costs residents, businesses, and U.S. taxpayers millions of dollars in repairs. From 1953 to 2008, there were 32 Presidentially-declared flooding disasters in Iowa and many additional floods that caused extensive damage but were not declared disasters. Two of the most recent and significant floods occurred in 2001 and 2008. In 2001, heavy storms and rapid snowmelt caused severe flooding and 13 counties were designated disaster areas. In 2008, extremely high winter and spring precipitation led to the second-highest totals ever recorded in Iowa, which resulted in floods affecting most of the State and 85 of Iowa’s 99 counties being Presidentially-declared disaster areas.
Loss Avoidance Methodology
In 2009, FEMA partnered with the State of Iowa to conduct a Loss Avoidance Study of flood mitigation projects that had been implemented throughout the State. This study was undertaken to verify the effectiveness of the flood mitigation projects and to document their economic performance. The losses avoided in all of the floods that have occurred since the completion of the mitigation projects were compared to the costs of the projects. Losses avoided are determined by comparing damage that would have likely occurred if the projects had not been completed to the damage that actually occurred with the projects in place. This study focused on the performance of acquisition, relocation, and elevation projects.
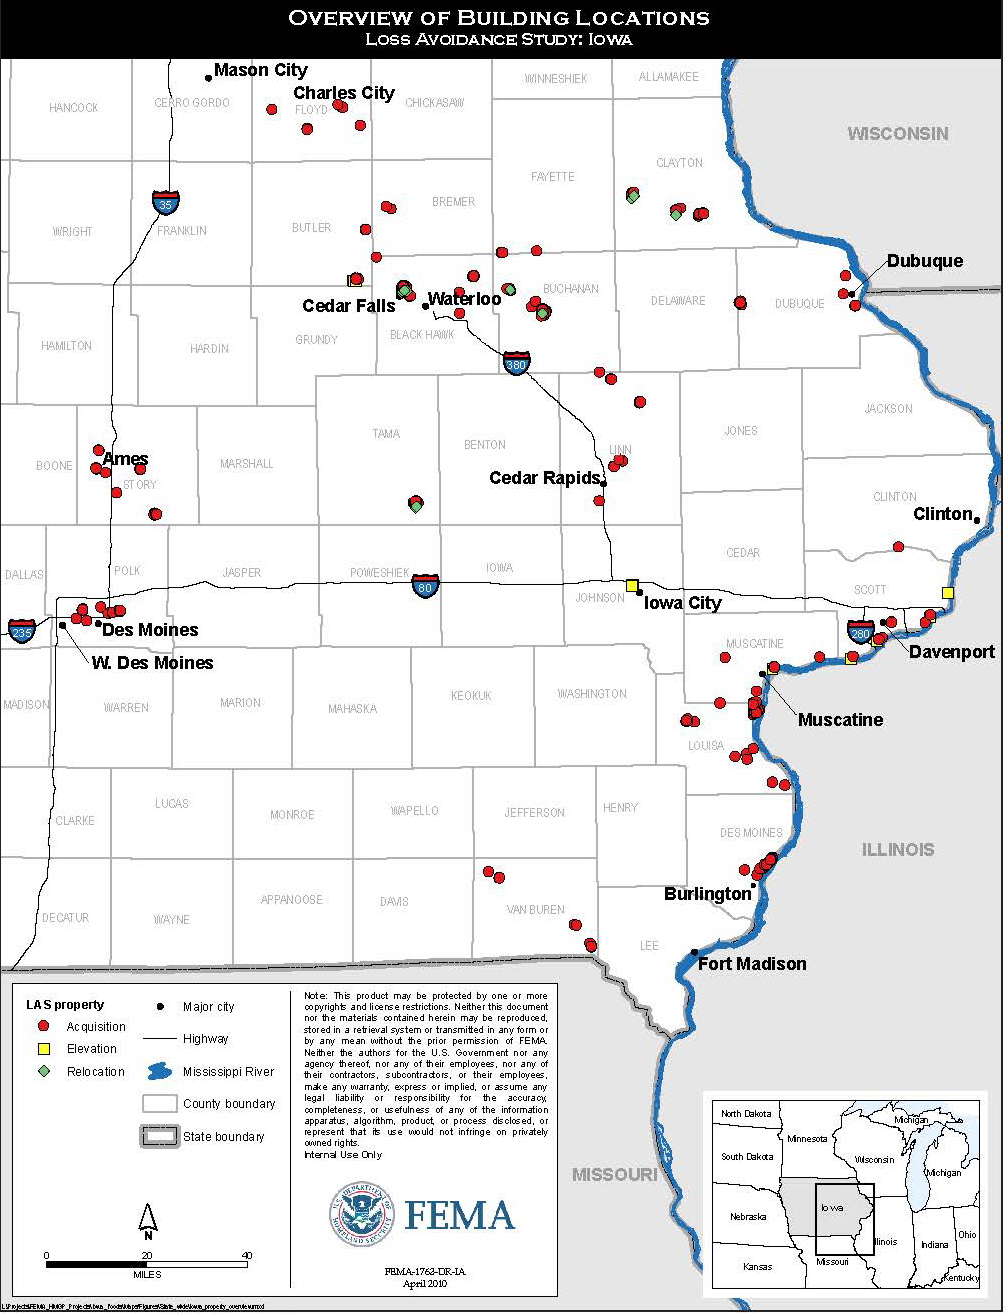
The study team initially considered analyzing 953 buildings. However, because of the rigorous data requirements needed to complete a losses avoided study (including detailed building and flood data), 574 buildings were eliminated from the study. Table 1 provides a breakdown of the remaining 379 buildings (also see Figure 1) located by county and the total losses avoided as a result of the mitigation measures.
This study calculated four types of losses avoided: two physical types of damage – building and contents and two-loss of function types of damage – displacement expense and disruption time for residents. These values are presented in Table 1. The physical damage estimates were based on the depth of flooding and compared actual damages versus damages that would have happened if the building had not undergone flood mitigation. The loss of function damages were calculated based on the costs required by the homeowner to rent a temporary space while repairs are being made and the wages that would be lost during this time.
Return on Investment
The ROI is calculated by comparing the losses avoided to the cost of the projects. An ROI of greater than 1 indicates that project benefits have exceeded project costs, and the project is considered cost-effective. The ROI of 1.02 for the entire study shows that Iowa’s investment in the studied mitigation projects was cost-effective. Additionally, the cost-effectiveness of the projects will continue to increase as more storm events occur and the value of the losses avoided increases.
Table 1. Return on Mitigation Investment and Loss Estimation Results for Buildings in the Iowa Study
| Analysis Information | Results by Loss Category | |||||||
|---|---|---|---|---|---|---|---|---|
| County | Number of Building Included in Analysis | Building Damage | Contents Damage | Displacement Costs | Disruption Costs | Total Losses Avoided | Project Investment | Current ROI |
| Black Hawk | 115 | $4,315,077 | $1,788,160 | $1,080,413 | $3,375,450 | $10,559,100 | $6,970,450 | 151% |
| Bremer | 2 | $70,355 | $40,782 | $22,792 | $42,039 | $175,969 | $179,137 | 98% |
| Buchanan | 76 | $608,146 | $376,069 | $43,954 | $614,212 | $1,642,380 | $5,046,773 | 33% |
| Butler | 12 | $681,624 | $316,183 | $72,606 | $262,452 | $1,332,865 | $709,916 | 188% |
| Clayton | 54 | $3,173,521 | $1,621,973 | $435,151 | $1,195,466 | $6,426,111 | $2,718,183 | 236% |
| Floyd | 4 | $412,554 | $148,552 | $46,247 | $124,088 | $731,441 | $343,737 | 213% |
| Johnson | 5 | $89,885 | $23,235 | $14,871 | $30,196 | $158,186 | $64,271 | 246% |
| Linn | 10 | $107,882 | $65,145 | $9,654 | $59,829 | $242,510 | $749,407 | 32% |
| Muscatine | 4 | $13,239 | $7,331 | $5,394 | $47,363 | $73,327 | $111,970 | 65% |
| Polk | 12 | $388,755 | $236,758 | $57,346 | $523,800 | $1,206,659 | $1,008,742 | 120% |
| Scott | 7 | $613,522 | $210,981 | $57,346 | $185,753 | $1,076,997 | $280,814 | 384% |
| Story | 57 | $148,426 | $89,992 | $41,396 | $181,228 | $461,042 | $5,051,598 | 9% |
| Van Buren | 21 | $29,905 | $17,074 | $21,486 | $123,314 | $191,778 | $558,451 | 34% |
| Total | 379 | $10,652,890 | $4,942,234 | $1,918,050 | $6,765,190 | $24,278,365 | $23,793,450 | 102% |