

Study Summary
Study Area – Kenosha, Jefferson, and Crawford Counties, WI
Hazard Type – Riverine Flooding
Project Type – Property acquisition and structure demolition
Total Project Cost – $10,996,559 (2009 dollars)
Total Losses Avoided - $14,551,039 (2009 dollars)
Return on Investment (ROI) – 1.32
Pre- and Post-Mitigation Events
Since 1982, every county in Wisconsin has experienced at least one flood event, and 19 counties have experienced more than 20 flood events each. Between 1990 and 2000, the two Wisconsin flood events that affected the most counties occurred in 1990 and 1993. The 1990 flood was accompanied by tornadoes and affected 17 counties across southern Wisconsin. Total damages exceeded $21 million. The Great Flood of 1993 was the result of two to three times the normal amount of rainfall across the entire state following a winter with greater than average snowfall. In the summer, every major river in Wisconsin flooded, and 20 dams were overtopped, broken, or washed away. Crop and soil damages, residential damages, and business losses totaled at least $877 million. More than half (46) of the State’s 72 counties were designated in the declaration. Flooding in southern Wisconsin in June 2008 was the most costly natural disaster in the State’s recorded history with damages estimated to exceed $1.5 billion.
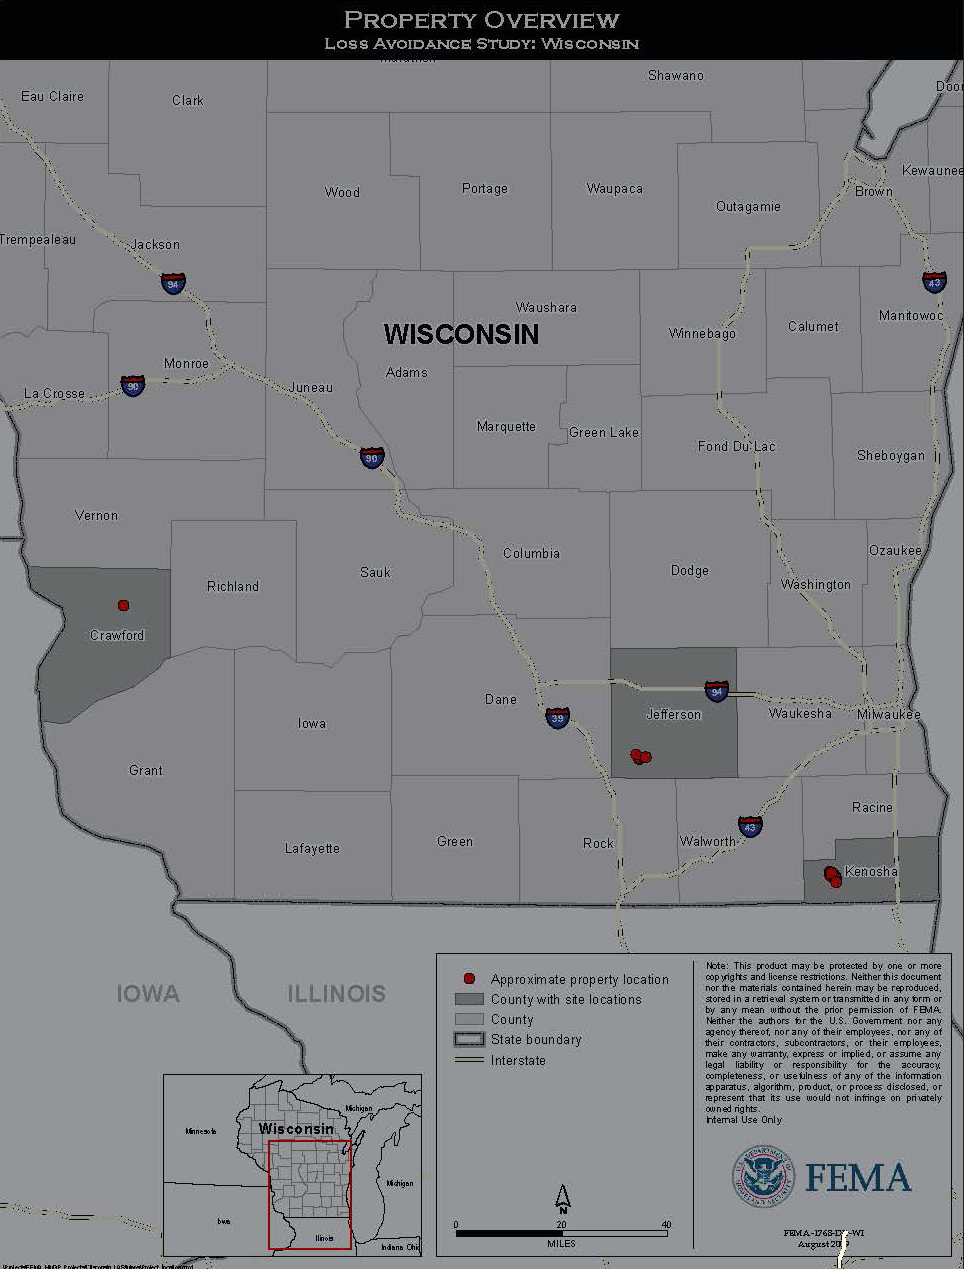
In response to the flooding, local governments in Kenosha, Jefferson, and Crawford Counties, with Federal and State assistance, acquired a total of 92 repetitive-loss properties from 1989 to 2008 at a cost of approximately $11 million. Figure 1 illustrates the property locations.
Loss Avoidance Methodology
In 2009 FEMA partnered with the State of Wisconsin and used the quantitative approach to complete a loss avoidance study for the acquisition projects. Losses avoided are determined by comparing damage that would have likely occurred if the projects had not been completed to the damage that actually occurred with the projects in place. This study focuses on 73 residential building acquisitions in Kenosha County, 18 residential building acquisitions in Jefferson County, and one public building acquisition and relocation in Crawford County between 1989 and 2008. The properties were acquired in the cities of Wheatland, Silver Lake, and Salem (Kenosha County); Fort Atkinson (Jefferson County); and Gays Mills
(Crawford County), which are affected by flooding from the Fox, Rock, and Kickapoo Rivers.
Tables 1, 2, and 3 provide a breakdown of the number of buildings considered by event date for each county and the total losses avoided as a result of the mitigation measures.
Table 1. Return on Investment and Loss Estimation Results in Kenosha County
| Analysis Information | Results by Loss Category | ||||||||
|---|---|---|---|---|---|---|---|---|---|
| Event Date | Number of Buildings Included in Analysis1 | Number of Buildings with Losses Avoided | Building Damage | Contents Damage | Displacement Cost | Disruption Costs | Total Losses Avoided | Project Investment2 | Current ROI |
| June-1996 | 8 | 3 | $22,508 | $13,795 | $225 | $19,460 | $55,986 | $988,615 | 6% |
February-1997 | 10 | 4 | $19,832 | $12,039 | $0 | $20,343 | $52,214 | $1,182,299 | 4% |
April-1998 | 11 | 3 | $10,509 | $6,918 | $0 | $12,516 | $29,942 | $1,318,900 | 2% |
June-1999 | 16 | 14 | $151,037 | $89,000 | $7,535 | $105,166 | $352,737 | $1,870,844 | 19% |
June-2000 | 22 | 18 | $110,853 | $69,653 | $4,935 | $95,205 | $280,647 | $2,495,784 | 11% |
June-2001 | 34 | 20 | $63,266 | $39,459 | $549 | $77,636 | $180,910 | $3,948,322 | 5% |
June-2002 | 45 | 13 | $29,506 | $18,814 | $0 | $44,174 | $92,493 | $5,024,413 | 2% |
May-2003 | 55 | 7 | $9,914 | $6,795 | $0 | $20,624 | $37,332 | $6,028,187 | 1% |
May-2004 | 57 | 50 | $509,699 | $308,143 | $25,480 | $361,724 | $1,205,046 | $6,243,728 | 19% |
February-2005 | 58 | 9 | $11,468 | $8,825 | $0 | $25,877 | $46,169 | $6,352,558 | 1% |
March-2006 | 62 | 23 | $49,311 | $34,031 | $0 | $76,126 | $159,468 | $6,790,484 | 2% |
August-2007 | 71 | 65 | $895,853 | $528,110 | $64,601 | $610,111 | $2,098,675 | $7,845,846 | 27% |
June-2008 | 72 | 68 | $1,286,888 | $742,212 | $127,733 | $818,008 | $2,974,840 | $7,971,390 | 37% |
April/ May- 2009 | 73 | 51 | $268,570 | $167,736 | $8,246 | $264,851 | $709,403 | $8,141,177 | 9% |
| TOTAL | $3,439,213 | $2,045,529 | $239,302 | $2,551,820 | $8,275,864 | $8,141,177 | 102% | ||
2 Project investment costs for each event only include the project costs for the buildings that were included in the analysis for that event.
Table 2. Return on Investment and Loss Estimation Results in Jefferson County
| Analysis Information | Results by Loss Category | ||||||||
|---|---|---|---|---|---|---|---|---|---|
| Event Date | Number of Buildings Included in Analysis1 | Number of Buildings with Losses Avoided | Building Damage | Contents Damage | Displacement Cost | Disruption Costs | Total Losses Avoided | Project Investment2 | Current ROI |
| April-1993 | 1 | 1 | $14,367 | $8,269 | $1,190 | $11,749 | $35,574 | $162,919 | 22% |
June-1996 | 5 | 4 | $8,372 | $7,227 | $- | $13,538 | $29,137 | $584,328 | 5% |
April-1999 | 10 | 1 | $476 | $457 | $- | $2,564 | $3,497 | $1,087,395 | 0.3% |
June-2000 | 12 | 8 | $21,885 | $18,435 | $- | $29,501 | $69,821 | $1,345,334 | 5% |
June-2004 | 15 | 13 | $92,162 | $59,103 | $2,151 | $84,422 | $237,839 | $1,676,168 | 14% |
April-2007 | 17 | 12 | $57,344 | $38,029 | $3,488 | $57,952 | $156,813 | $1,903,128 | 8% |
June-2008 | 18 | 18 | $680,052 | $340,856 | $111,508 | $344,988 | $1,477,403 | $2,191,601 | 67% |
March-2009 | 18 | 16 | $136,167 | $84,116 | $8,485 | $106,874 | $335,643 | $2,191,601 | 15% |
| TOTAL | $1,010,826 | $556,492 | $126,822 | $651,586 | $2,345,726 | $2,191,601 | 107% | ||
2 Project investment costs for each event only include the project costs for the buildings that were included in the analysis for that event.
Table 3. Return on Investment and Loss Estimation Results in Crawford County
| Analysis Information | Results by Loss Category | ||||||||
|---|---|---|---|---|---|---|---|---|---|
| Event Date | Number of Buildings Included in Analysis1 | Number of Buildings with Losses Avoided | Building Damage | Contents Damage | Displacement Costs | Loss of Function Costs | Total Losses Avoided | Project Investment2 | Current ROI |
| August-2007 | 1 | 1 | $313,198 | $239,331 | $0 | $1,282,521 | $1,835,050 | $663,780 | 276% |
| June-2008 | 1 | 1 | $345,427 | $265,575 | $0 | $1,483,397 | $2,094,399 | $663,780 | 316% |
| Total | $658,624 | $504,906 | $0 | $2,765,918 | $3,929,449 | $663,780 | 592% | ||
2 Project investment costs for each event only include the project costs for the buildings that were included in the analysis for that event.
This study calculated four types of losses avoided: two physical types of damage – building and contents and two loss of function types of damage – displacement expense and disruption time for residents. These values are presented in Table 1 for Kenosha County, Table 2 for Jefferson County, and Table 3 for Crawford County. The physical damage estimates are based on the depth of flooding and compare actual damage to damage that would have occurred if the building had not undergone flood mitigation.
The loss of function damages were calculated based on the costs to the homeowner to rent a temporary space while repairs are being made and the wages that would be lost during this time.
Return on Investment
The ROI is calculated by comparing the losses avoided to the cost of the projects. An ROI of greater than 1.0 indicates that project benefits have exceeded project costs, and the project is considered cost-effective. The ROI of 1.32 for the entire study shows that Wisconsin’s investment in the studied mitigation projects was cost-effective. Additionally, the cost-effectiveness of the projects will continue to increase as more storm events occur and the value of the losses avoided increases.